
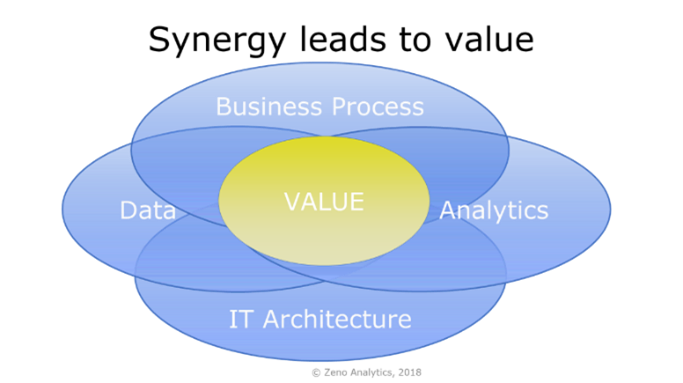
To derive value from analytics you need to create a synergy between four dimensions: Business Process, Data, IT Architecture, and Analytics as the glue to bring them together. The intersection of the convergence of these four dimensions is where you can optimize your decision making and derive value from your efforts.
Setting up a decisioning framework helps you clarify what guides your decision making:
- What are your business objectives?
- What are your business goals linked to those objectives?
- What limitations do your ethics and values put on your decision making?
- What limitations or requirements are put on your decision making by society (legal, social norms, …)?
- How do you want to make decisions and monitor and control decision making in your processes?
- What decisions you make in which processes?
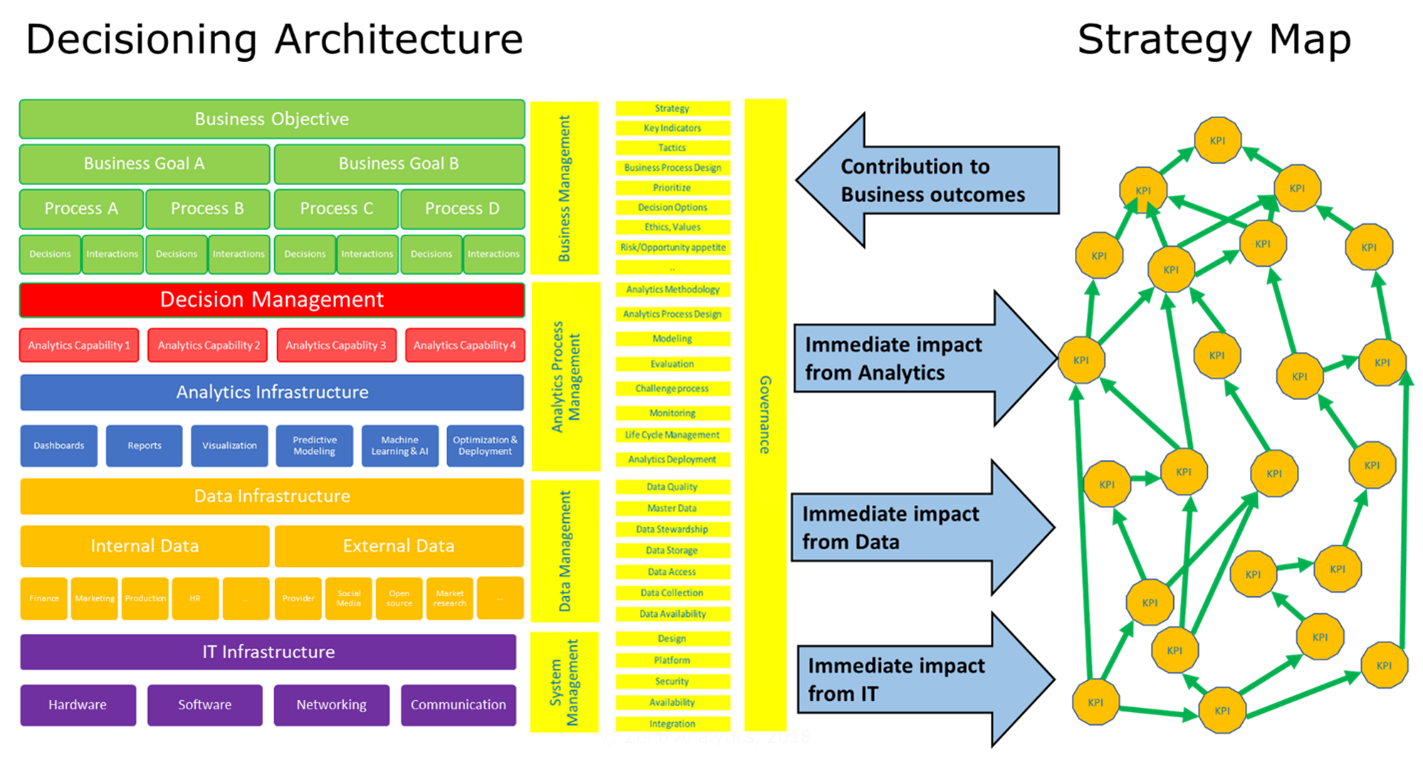
Based on that framework you can define a business architecture that can support decision making in your organization: a Decisioning Architecture
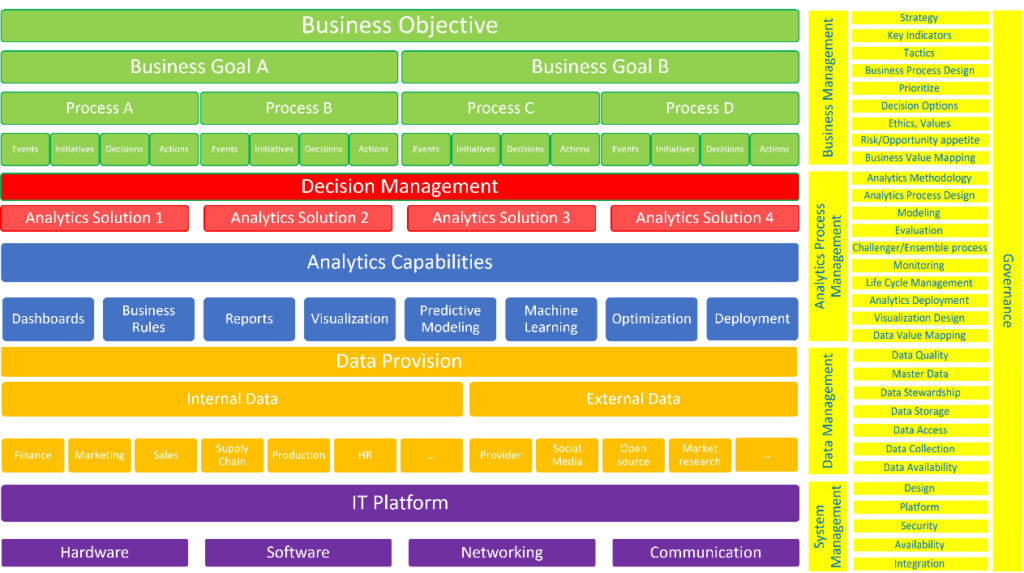
Components of the Decisioning Architecture
The Decisioning Architecture contains 4 levels of components as displayed below.
- Business (in green)
- Decision Management (in red) and Analytics Capabilities (in blue)
- Data Provision (in orange)
- IT Platform (in purple)
On the right-hand side (in yellow) the management roles and their responsibilities are displayed. With the increased regulations and the importance of an organization’s ethics & values an overarching governance process is crucial.
Business management is responsible for setting strategy and translating that into business objectives and how they are measured. These objectives can then be targeted using different tactics and the related business processes where business management sets priorities and determines decision options. All of this is embedded in the ethics & values that define the organization and it is linked to the aggressiveness/defensiveness: the risk/opportunity appetite.
Analytics Process Management is responsible for defining how analytics will be performed and linking the output of the analytics to the decision made in the business process. They are also the guardians of analytics quality. They need to implement a constant critical review process that monitors and challenges the analytics. They need to manage the life cycle of analytics. To do this they need to define what is needed in the analytics infrastructure and how the developed analytics capabilities can be best managed to support the decisions in the decision management approach.
Data Management is responsible for the availability, quality, collection and storage of the relevant internal & external data. The data infrastructure is the foundation of analytics & data driven decision making: bad data à bad analytics à bad decisions.
Finally, systems management needs to make sure the technical IT infrastructure is available, secure and allows for integration of data, analytics and business processes.
.
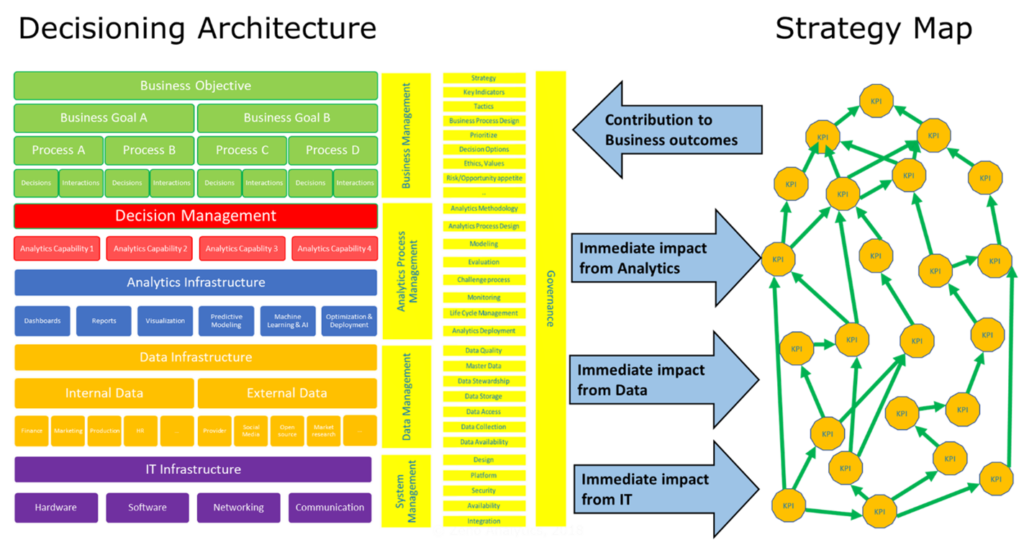
Analytics Strategy Value Map
This framework is based ‘Value Modeling: A Systematic Method to Unveil the Business Value of Industry Solutions’ (Proceeding of 2014 Annual SRII Global Conference) and the concept of strategy mapping from the balanced scorecard approach (See for example ‘Having Trouble with our Strategy? Then Map It’ by Robert Kaplan and David Norton (HBR 2002). The basis is to map your KPI’s on all levels from business objectives, down to your operational processes, and make sure that you understand how they influence each other to the top.
Mapping the Strategy
The goal of the Analytics Strategy Value Map is to link the Decisioning Architecture and the activities in that architecture to the KPI’s at different levels. This allows you to relate it back to your overall strategic objectives. By using this map, you can look at the immediate impact of IT, the immediate impact of data, the immediate impact of analytics, and link that back to the business outcomes as displayed.
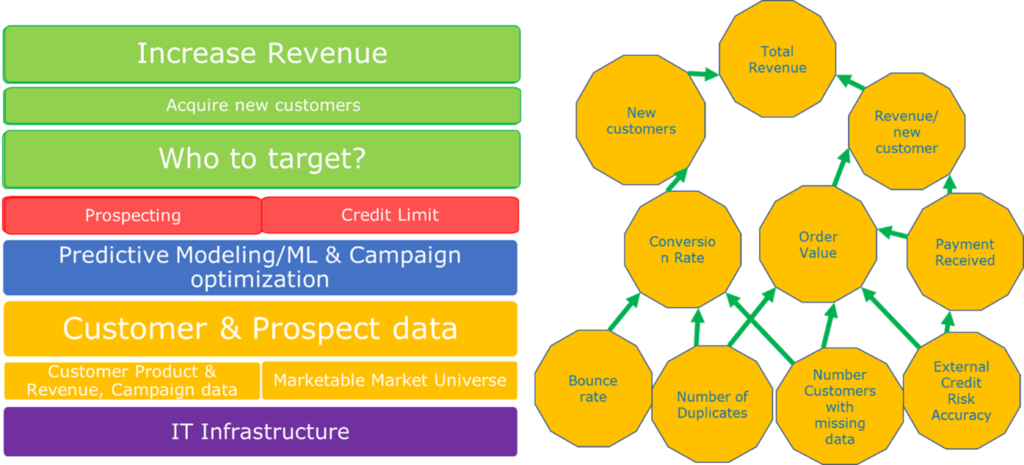
A simplified example
- Your main business objective is to increase revenue.
- A business goal attached to this objective could be to acquire new customer.
There could be many others, of course, like: sell more to current customers, retain more customers etc. - A decision that you may want to think about is ‘who do you want to target?’.
- You will need, for example, the analytic capabilities on prospecting and credit limit modeling. Prospecting to find the targets, and credit limit modeling to determine how much you are willing to sell to them.
- You could use Predictive Modeling/Machine Learning and Campaign Optimization to find the right targets.
- As input you would need, from the data infrastructure, Customer & Prospect data, which could be from your internal data: Customer Product information and revenue information, and previous campaign data. From an external data provider for example the marketable universe for the potential customers in your market.
- All of this is supported by the infrastructure with analytics technology, databases, hardware and a way to get the results back into you marketing decision making.
Mapping this, you could say at the top end, for example, that your KPI is your total revenue, and that you drive that on your business goals with your number of new customers and revenue per new customer. So, using prospecting and credit limit, you could influence the conversion rate, order value, and the payment received. That is driven also by, for example, by data quality indicators, like the bounce rate, or the number of duplicates in your customers in your customer file; they have an influence on the conversion rate, and on the order value, because if you have the wrong information on your customers, you might be missing out on valuable prospective customers. The same goes for the number of customers with missing data. And then of course your external credit risk accuracy model because that influences your payment received, but also your order value, because it influences your credit limit decision.
Creating a prioritization matrix
Once you’ve looked at ‘where are my potential value drivers from analytics?’, you can look at the expected value and the expected effort. These you can use to build a prioritization matrix.
The example here is simple: a high/low division where if the expected value is high, and the expected effort is low, that is your low hanging fruit.
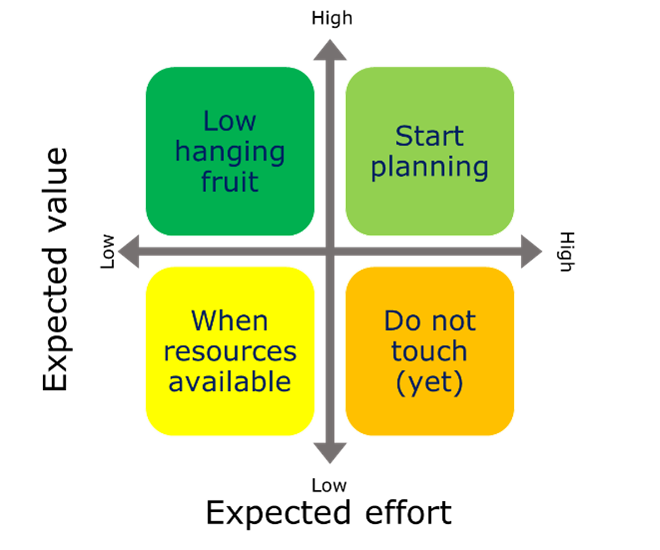
When the expected value is high and the expected effort is high, you may want to start planning those initiatives. When the expected value is low, and the expected effort is low, you may want to do that when resources are available. The ones where the expected effort is high, but the expected value is low, you do not want to touch it yet. That may change in the future, and you may identify that there is an influence of some of those on other high value ones. They then can move across this matrix.
It’s not fixed in time. You need to reevaluate this prioritization matrix on a regular basis.
How to determine this value and effort basically is by doing a “proof of value” project: a limited time project with clear goals linked to the business objectives. You need to make sure that it is not just an academic exercise but that it leads to real results. Then you can evaluate the actual expected value of analytics for your own organization.